fiftynine.io


Plotting SQL Server Performance Using R
What am I doing here
One of my favourite tasks is to investigate and troubleshoot performance problems on a SQL Server instance, and a tool I use to measure performance is Performance Monitor.
In most cases I use this template the capture the Perfmon counters I’m concerned with, and I set the schedule to capture every 15 seconds and I use this guide as my reference.
Whenever our clients experience performance related issues with the database I’m able to jump on to the server in question and grab off the Perfmon collector sets, usually for the whole month prior to the problem.
I do this so I can check the Perfmon counters against the same days for the immediate weeks past to quickly identify a problem, and more often to remove red herrings. For example, I may see that a lowish PLE value, but actually it’s the similar today as it has been on the same day for the last three weeks. I can rule this out and won’t need to spend time investigating it to discover it’s not the issue a few hours later.
Perfmon needs sorting
I set Perfmon to record to a new file in a new directory at the start of every day. When an issue arises I zip up the relevant files and copy them to my PC locally. This usually leaves me with around 30 folders and a Perfmon collector set in each one, so I use the following Powershell script to sort the files into one folder.
Get-ChildItem -Path 'C:\Temp\perfmonfiles' -Recurse -File | Move-Item -Destination 'C:\Temp\Perfmon'
Now I have all the Perfmon collector sets in one folder I used Relog to import the data into my database. I use the following script to achieve this task.
Get-ChildItem "C:\Temp\Perfmon" -Filter *.blg | Sort-Object Name |
ForEach-Object {
        relog $_.FullName -f SQL -o SQL:pm!Perfmon
    }
Relog uses an ODBC connection which needs to be configured prior to running Relog. If you aren’t sure how to do this you can follow this guide. My ODBC DSN is called pm.
Lots of data
Now the data is in the database I can start working on it to investigate the problem. R is my new tool of choice. It’s a free programming language for statistical analysis and it’s brilliant for sorting out the vast amount of data you get inside a Perfmon collector set.
I’m really excited about what can be achieved using R and I feel this is so far just scratching the surface.
To begin I installed Microsoft R Open, which is
the enhanced distribution of R from Microsoft Corporation
and then I installed RStudio which is IDE for R.
I then needed to expose the Perfmon data stored in my database to R. This is achieved by using the same ODBC DSN I use to import Perfmon with Relog and RODBC. RODBC needs to be installed by running the following command in the R terminal.
install.packages("RODBC")
I can now connect to the database, pass through a query and view a summary calculated by R.
library("RODBC")
PerfmonODBC<-odbcConnect("pm")
Perfmon<-sqlQuery(PerfmonODBC,"select distinct a.CounterDateTime, b.CounterName, b.CounterValue from CounterData a inner join CounterDetails b on a.CounterID=b.CounterID where b.CounterName = '% Processor Time' and b.ObjectName = 'Processor' and a.CounterDateTime>='2018-08-21'")
summary(Perfmon)
I can use this to grab some quick information about % Processor Time but I can do this much quicker in powershell than in R so what I really want to do is plot some charts.
First I installed another couple of packages.
install.packages("ggplot2")
install.packages("reshape2")
After they’re installed I can use them to plot a chart that shows Processor Time over the course of the day.
library("RODBC")
library("ggplot2")
library("reshape2")
perfmonODBC<-odbcConnect("pm")
perfmon<-sqlQuery(perfmonODBC,"select distinct a.CounterDateTime, b.CounterName, a.CounterValue from CounterData a inner join CounterDetails b on a.CounterID=b.CounterID where b.CounterName = '% Processor Time' and b.ObjectName = 'Processor' and a.CounterDateTime>='2018-08-21'")
perfmon$CounterDateTime <- as.POSIXct(perfmon$CounterDateTime)
ggplot(data=perfmon, aes(x=CounterDateTime,y=CounterValue, colour=CounterName)) +
geom_point(size=.1) +
stat_smooth() +
ggtitle("Server1 - % Processor Time - 21-08-2018")
odbcCloseAll()
This created the following graph.
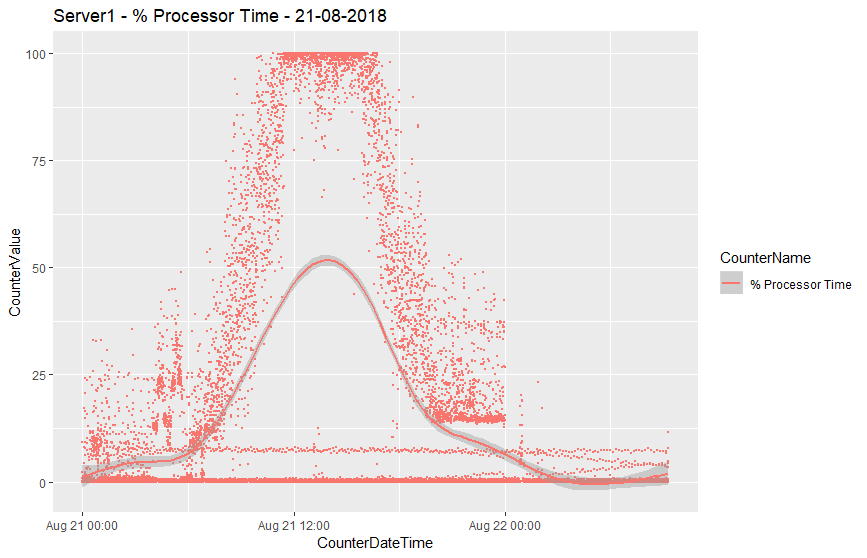
The whole process takes seconds to plot and it provides an immediate picture of processor usage over the day. I then modified the query slightly to look at the Processor object rather than just the % Processor Time counter.
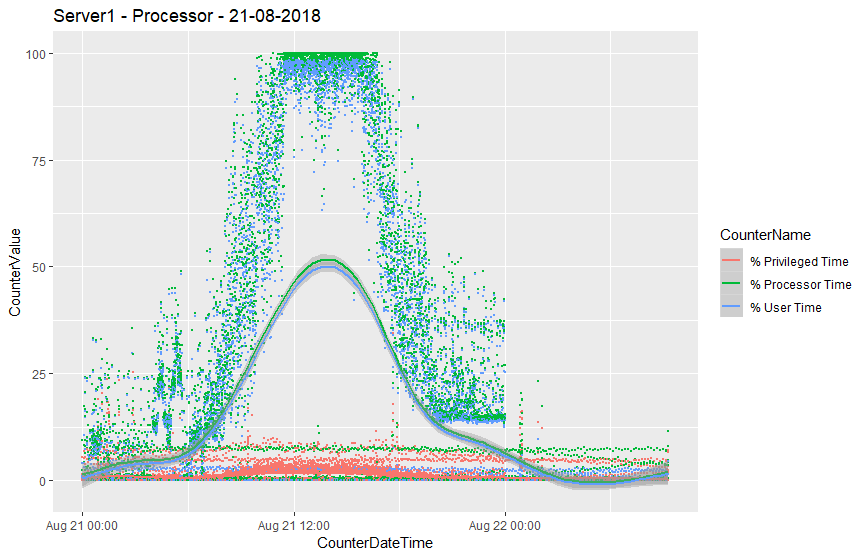
This is very, very cool. I love this way of being to view data in this way quickly and easily. I used to use Excel to do this and for the most part it worked, but it was sluggish and slow, and without delving into vbscript difficult to do it programmatically. R is awesome and takes care of all of this.
A bit of clean up
Rather than writing a new R script to view each area of the server, I then wrote a number of views that focused specifically on the Perfmon counters that I want to group into charts. This is still a work in progress but so far I have a view for
- Memory
- CPU
- Disk
- Network
- Waits
- Compilations
I can then update my R script to use the view instead. It keeps things clean and tidy and I can quickly change the script to r.CPU to r.Memory and I can chart memory for the same period.
library("RODBC")
library("ggplot2")
library("reshape2")
perfmonODBC<-odbcConnect("pm")
perfmon<-sqlQuery(perfmonODBC,"select * from r.Memory where CounterDateTime>'2018-08-21'")
perfmon$CounterDateTime <- as.POSIXct(perfmon$CounterDateTime)
ggplot(data=perfmon, aes(x=CounterDateTime,y=CounterValue, colour=CounterName)) +
geom_point(size=.1) +
stat_smooth() +
ggtitle("Server1 - Memory - 21-08-2018")
odbcCloseAll()
With R I can prepare and interrogate Performance Monitor data in minutes, I can use this to present to colleagues and clients as a visual aid when explaining a problem and solution. I can use it to quickly identify problem areas and rule out red herrings.
Next steps are to create an R server for heavier data processing, which I’ll be sure to blog about next time.
Thanks for reading, I hope this has been useful and if you’d like to comment don’t hesitate to contact me using the one of the social buttons below.